Focused Ion Beam Molecular Dynamics Tool Overview
The nanohub.org FIBMD Page
The FIBMD tool’s intended use is for visualization of sputtering and surface deformation on silicon as a result of a gallium Focused Ion Beam.
Output Information
out.log
In the out.log, information is provided regarding the current state of the simulation. The first lines of “x done” indicate that initialization routines for the domain generation, input parameters, data arrays, etc., have completed.
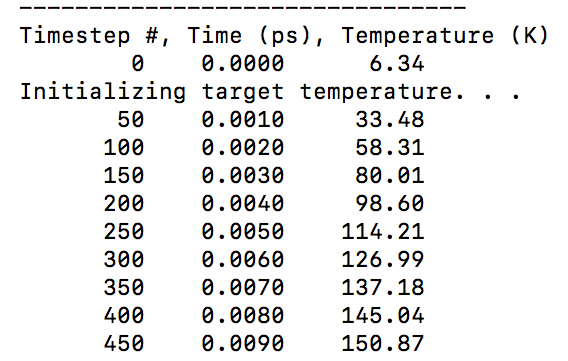
As indicated by the column headers, the primary output’s first column is the timestep number, the second column is the simulated time in picosends, and the third column is the average system temperature. This temperature does not include atoms that were sputtered and then frozen, or any gallium atoms.
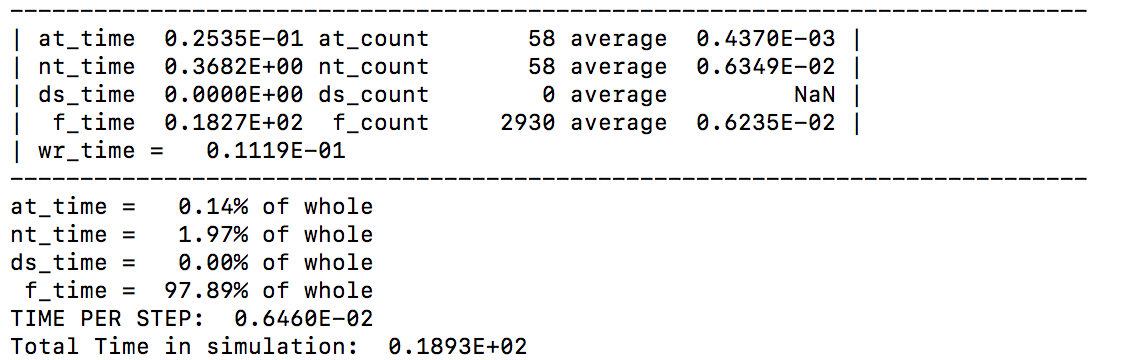
After temperature initialization and each ion firing, information is printed regarding the distribution of computational time across routines. ‘at_time’ is the time taken to geometrically redistribute atoms over the parallel processors, ‘nt_time’ is the time taken for generating neighborlists, ‘ds_time’ is the time taken to check the kinetic energies of all atoms and determine whether the timestep value should change, ‘f_time’ is the time taken to evaluate all atomic forces, and ‘wr_time’ is the time taken to write all output files. Similarly, the ‘x_count’ indicates how many times each of the prevous operations were conducted. Each of these parameters is reset after reporting, so information printed for each ion firing is independent.
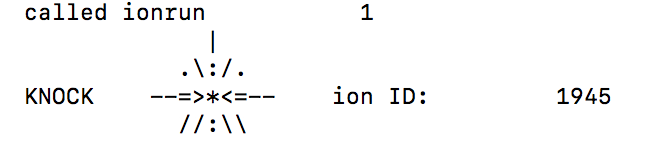
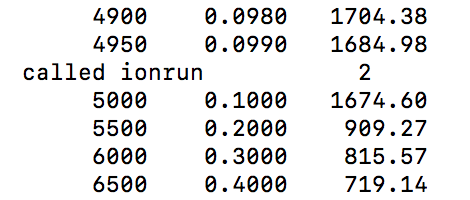
The ‘KNOCK’ line indicates that an ion has been fired at the surface, and is followed by the atomic ID of this ion. This ID is consistent with the numbering of atoms in the .xyz output files. The lines reading “called ionrun x” indicate that for x = 1, small timesteps are being used, and for x = 2, large timesteps are being used. This is determined according to the ion energy description on the nanohub FIBMD page.
mdrun2.xyz
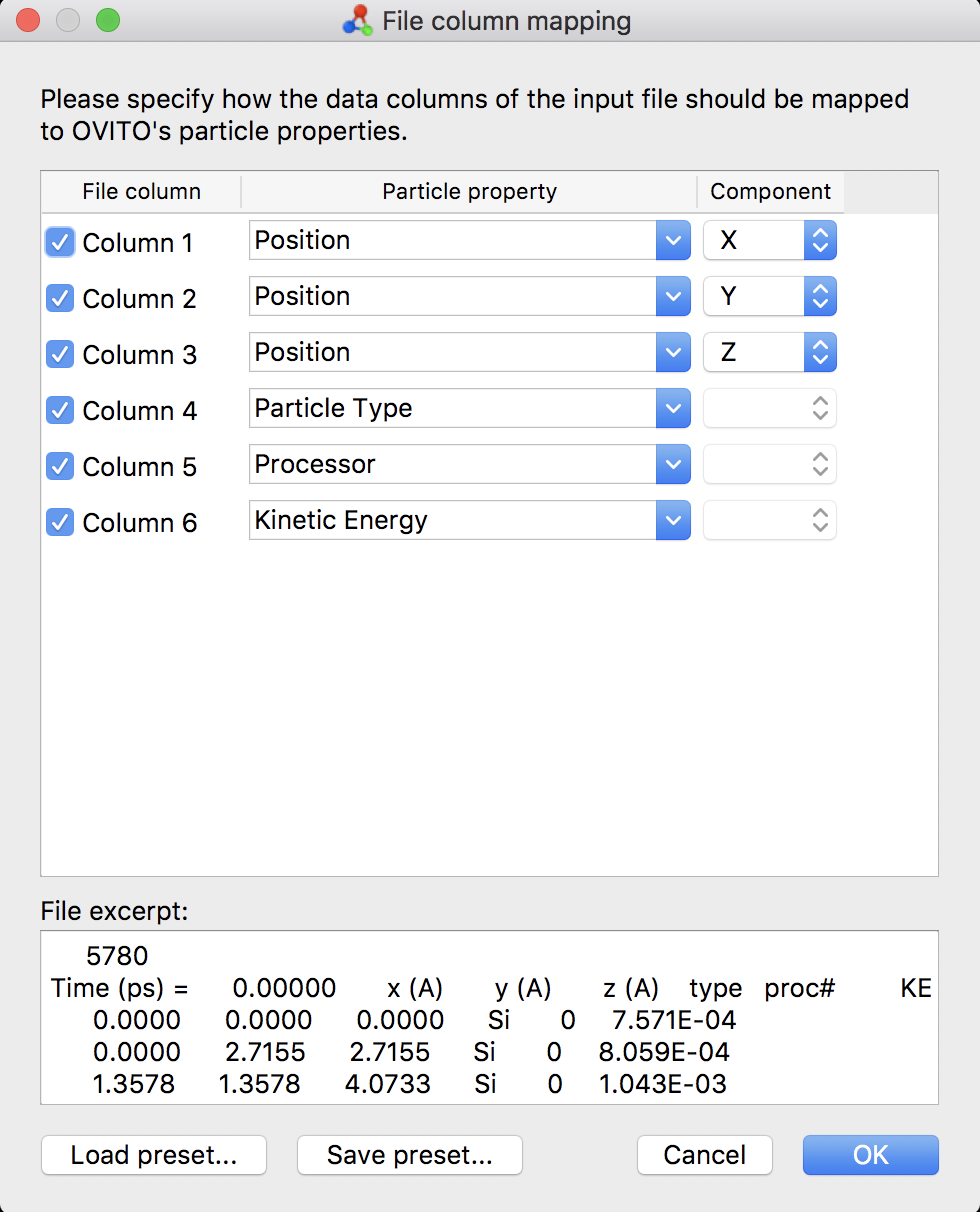
The mdrun2.xyz file follows an extended xyz file format. Each system snapshot is provided as a distinct chunk, with the first line indicating the number of atoms, the second line indicating the snapshot’s time in the simulation along with column headers, and the following lines providing information on each atom in the system. The first three columns are atomic positions in Angstroms, the fourth column is the atomic type designator (‘Si’ or ‘Ga’), the fifth column is the processor # responsible for the atom, and the sixth column is the kinetic energy of the atom in eV. It is suggested that this file be analyzed using Ovito.
Ovito
For installation of Ovito, refer to Ovito.org.
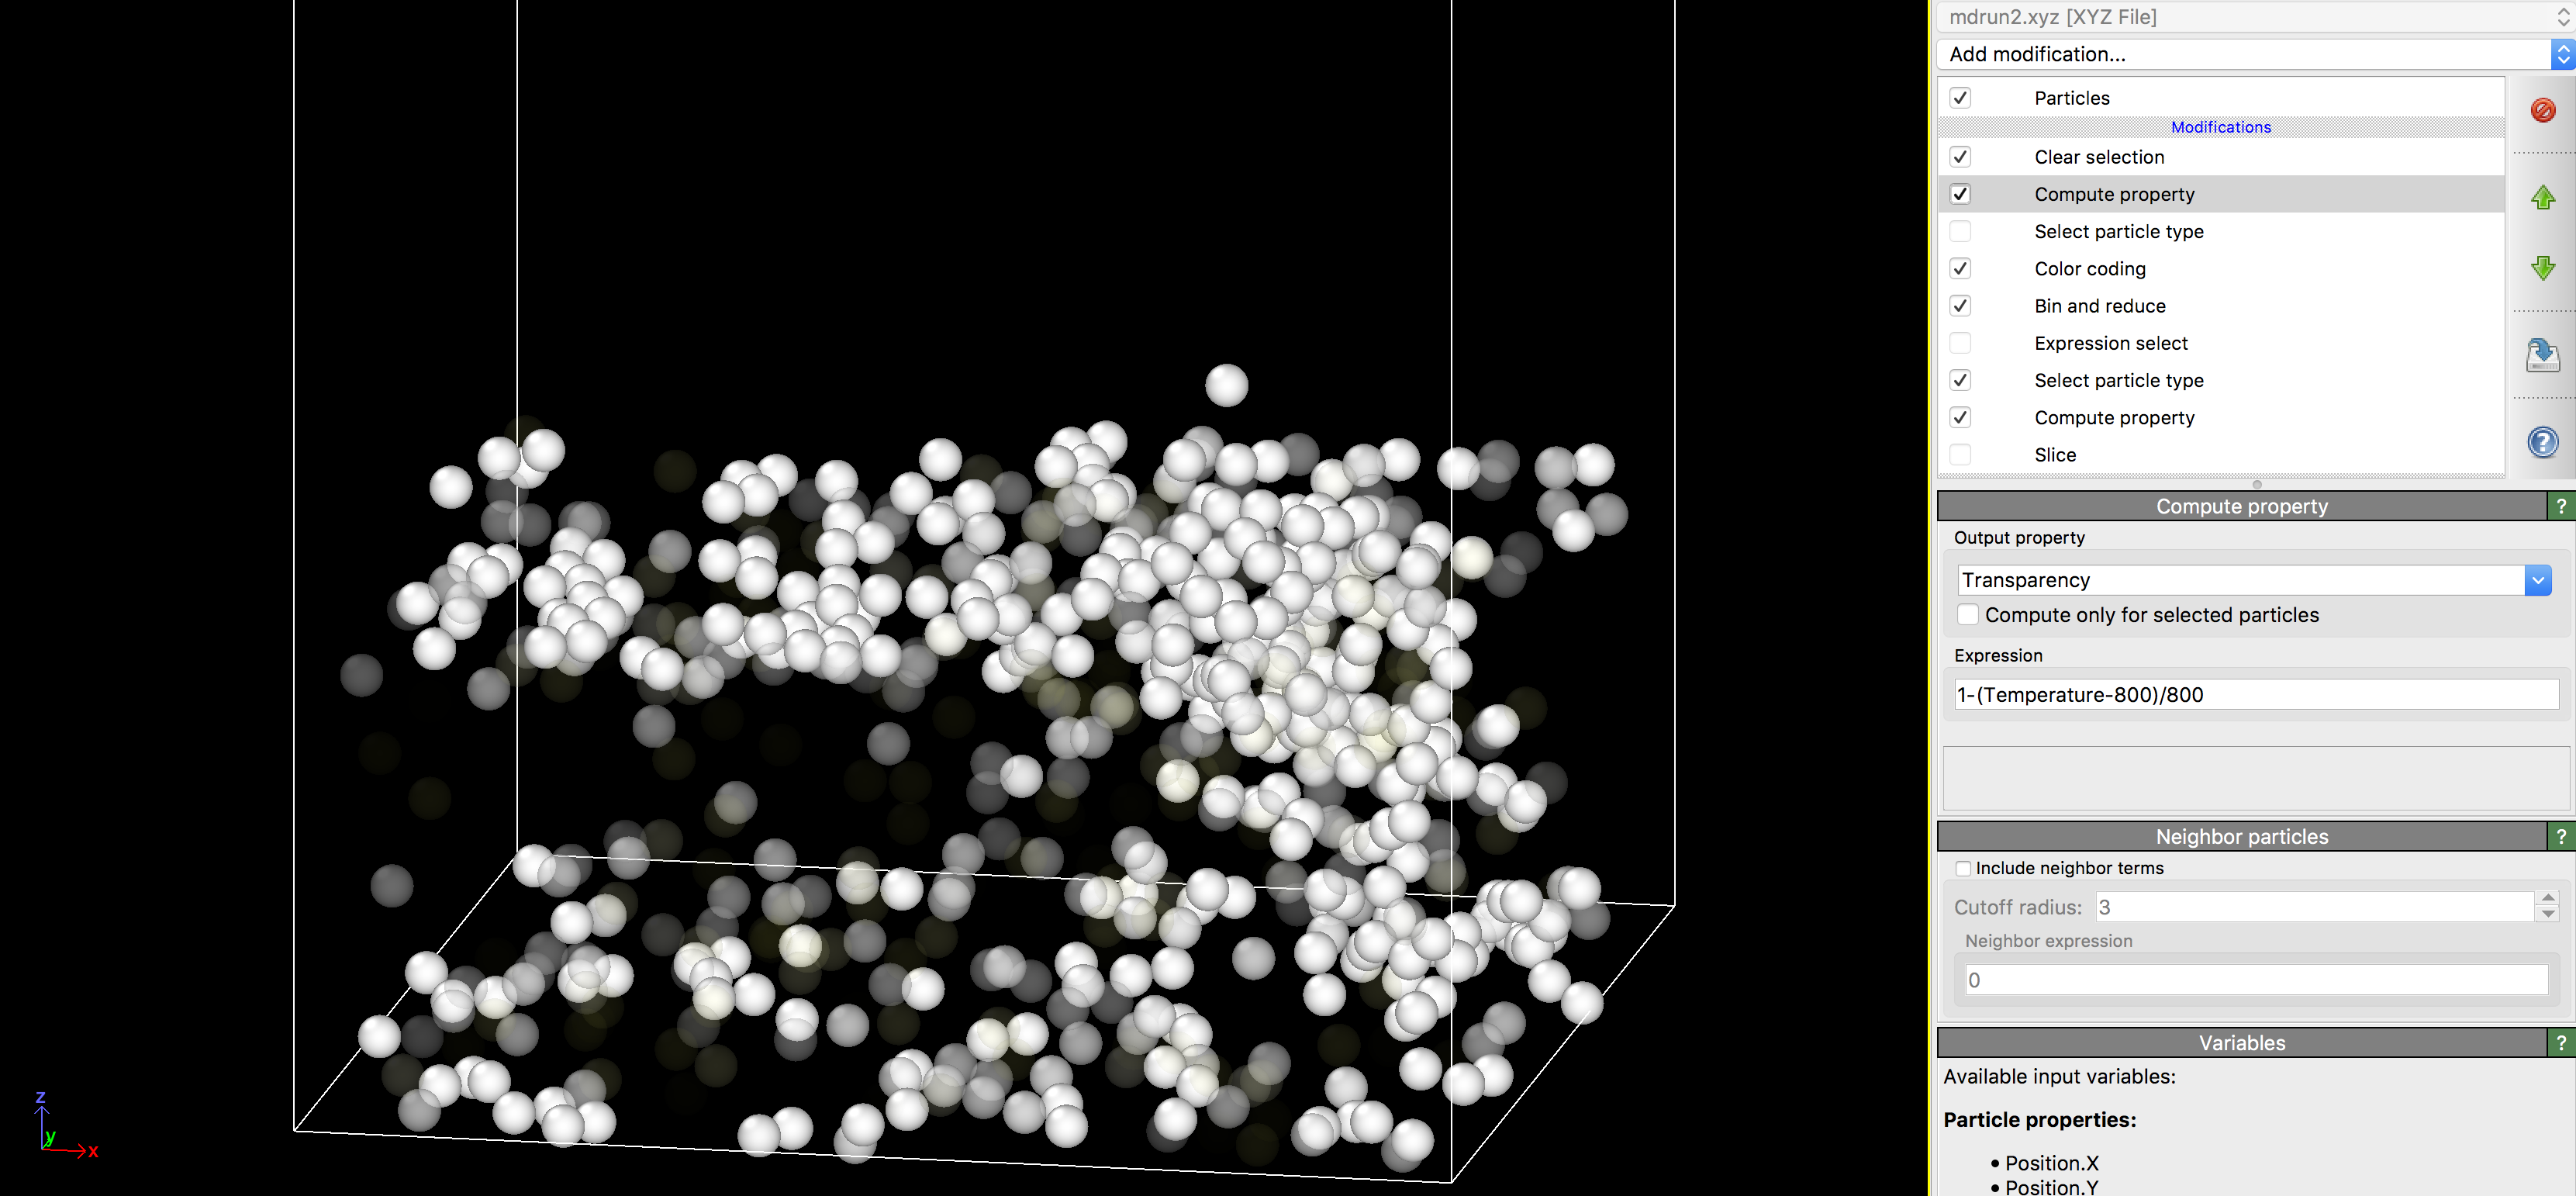
Once Ovito is installed, you may either start your analysis from scratch by immediately loading the xyz file and assigning each column’s data as described above, or you may load in the ‘Program State’ file provided from within the FIBMD tool. To load either, press the corresponding button as indicated in the image below.
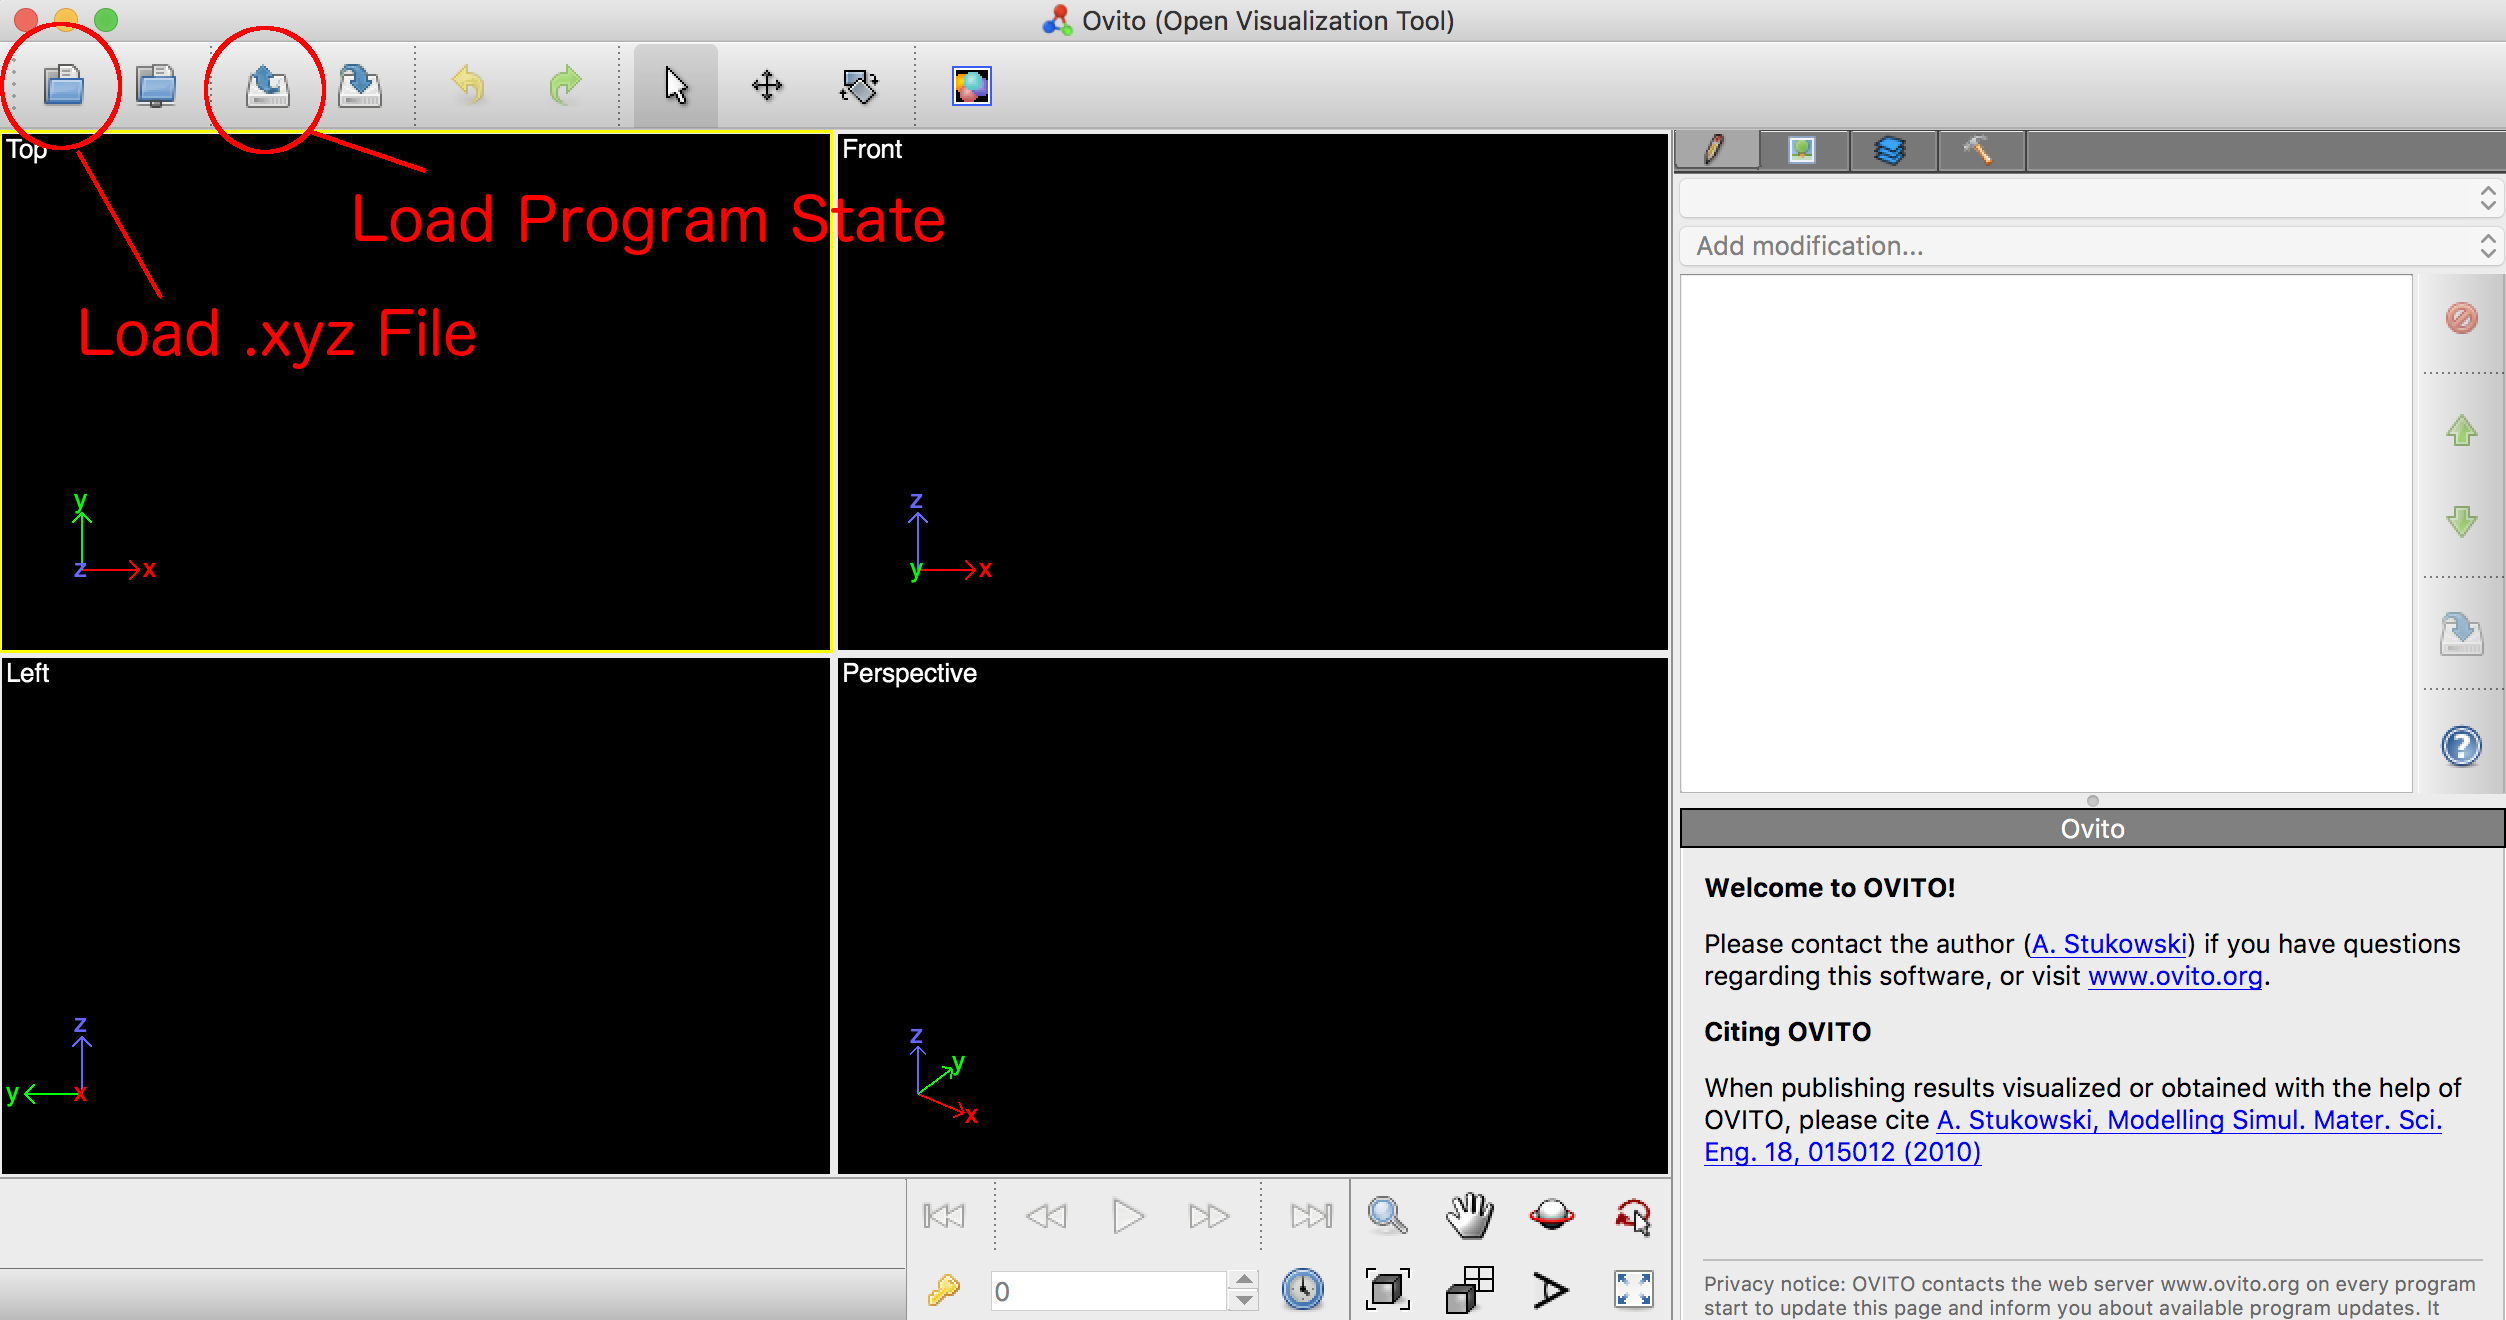
If you first load the program state, you will initially receive an error indicating that the .xyz file could not be found, as the program state was generated on my system. This is fine, simply press ‘OK’ and proceed to click on the button indicated by ‘Load xyz File’ in the above image. Browse to where you saved the .xyz file and select it. Ovito should recognize it as xyz format, and if you have already loaded the program state, the column assignments should be populated for you.
As the program state already tried and failed to load in an xyz file, you will be prompted with a box saying something like ‘When importing the selected file, do you want to keep the existing objects?’ Select ‘Replace Selected’ to load in the new file and discard the failed attempt. By default, Ovito will only load in the first snapshot of the file, however. In the menu on the right, scroll down to the bottom of the top-right window and select ‘mdrun2.xyz [XYZ File] under the ‘Input’ section.
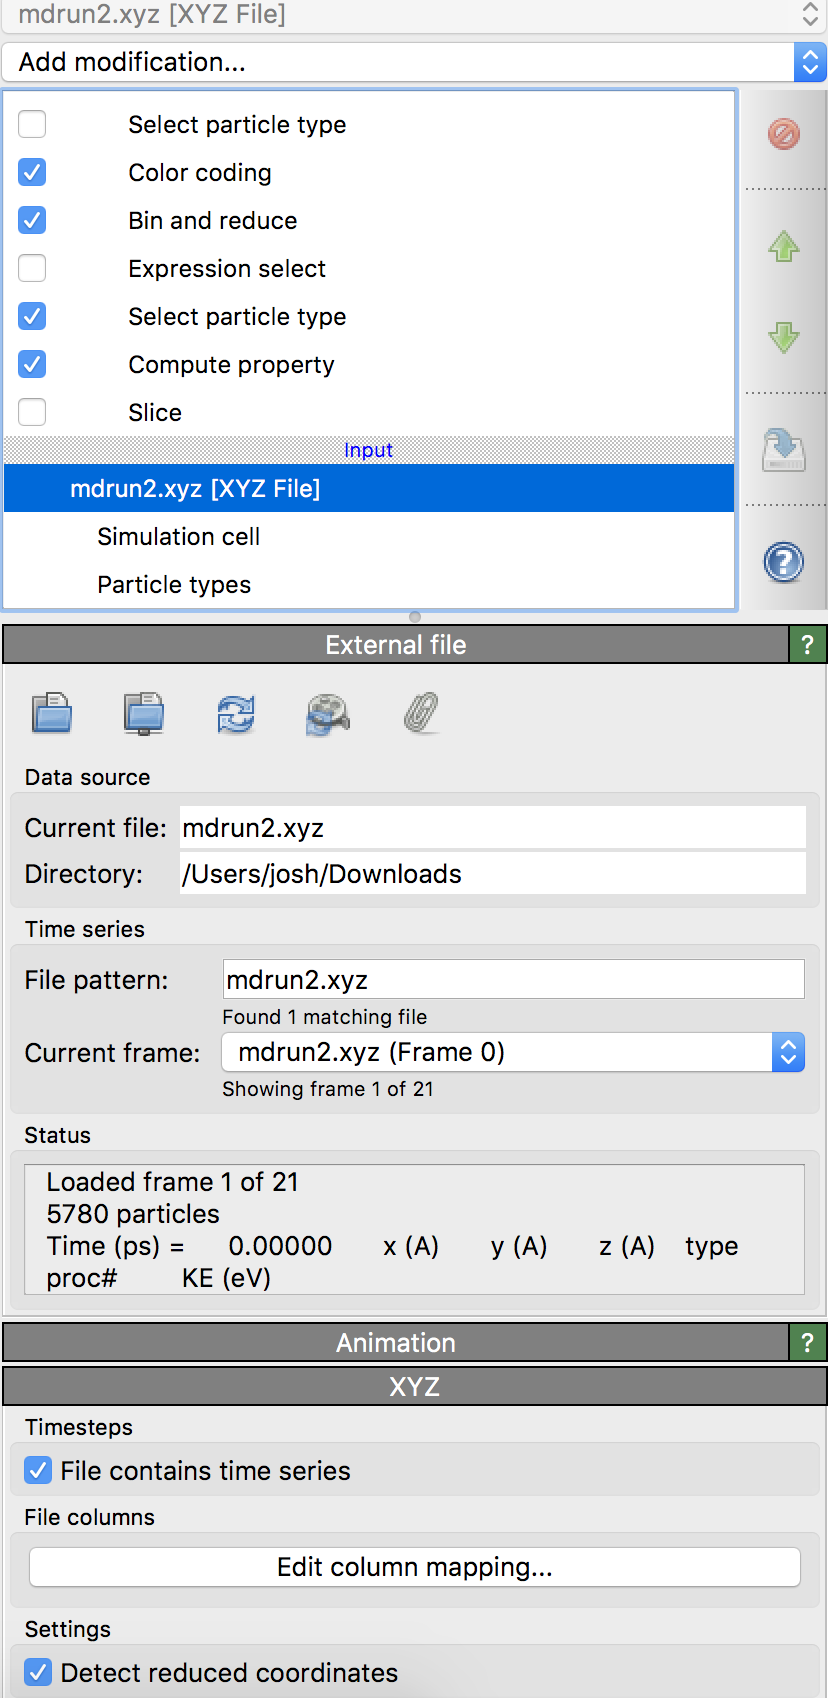
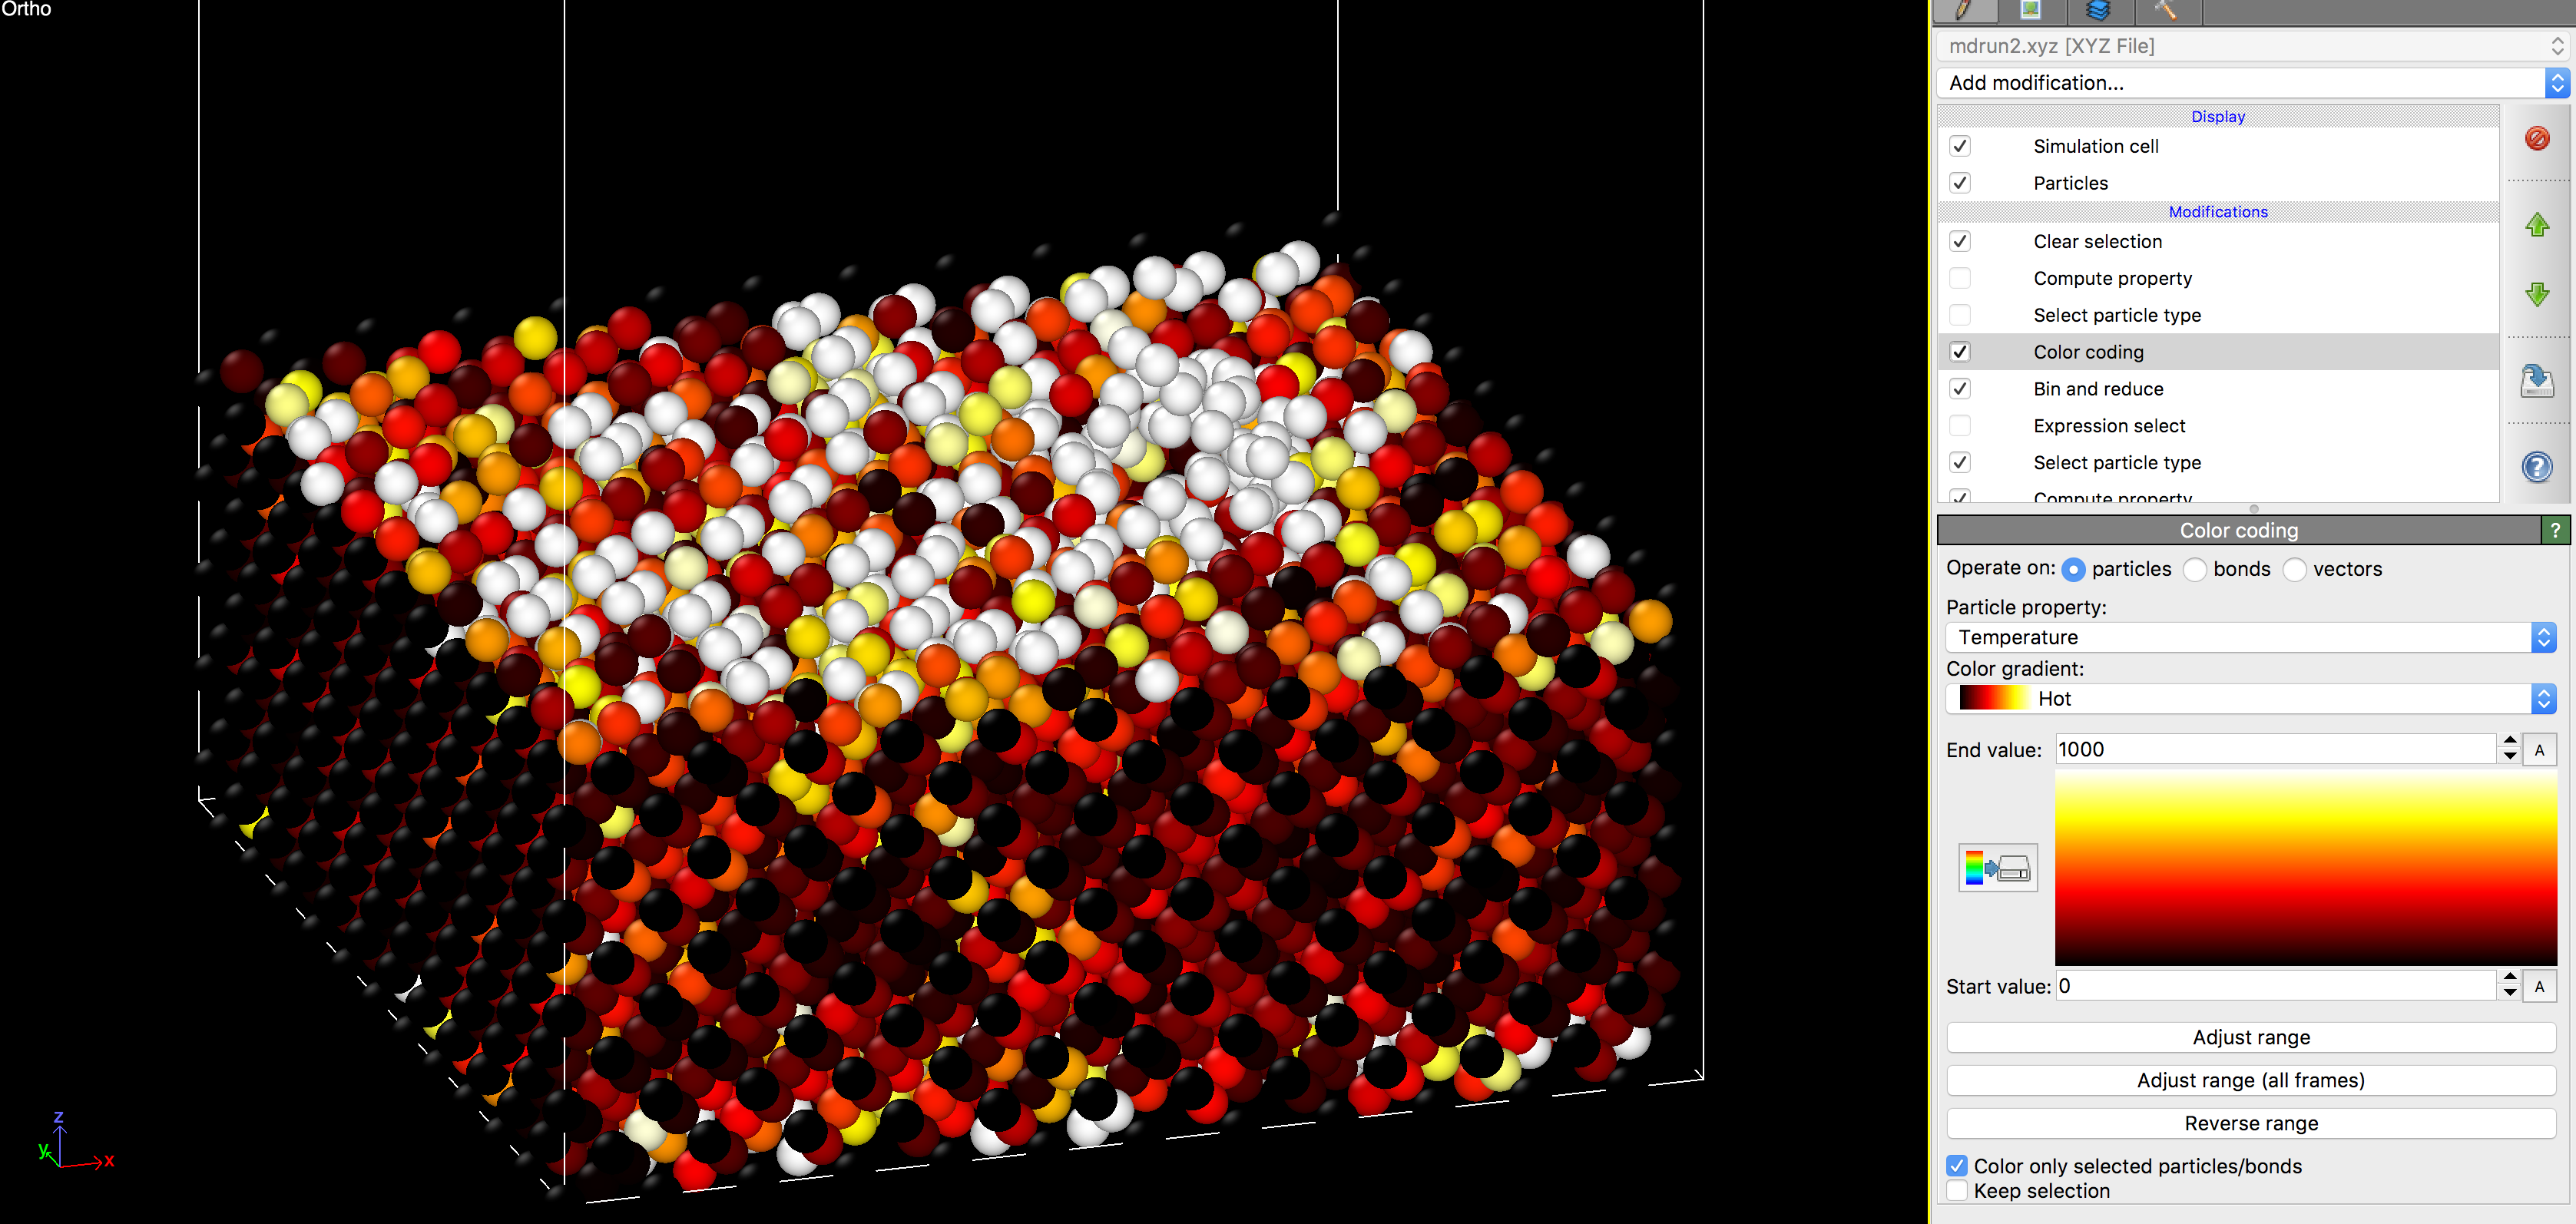
Then, at the bottom of the right panel, check the box next to ‘File contains time series’. This will load all timesteps in, and you can access each frame through the video player buttons at the bottom. The program state will be default color the atoms according to their temperature. All of the routines for coloring and analyzing the data will be under the ‘Modifications’ section on the right.
If you enable the top-most ‘Compute Property’ option, the transparency of each atom will be adjusted according to its temperature. In the default setting, this will hide cold atoms, and can be useful for visualizing the damage cascades caused during/ immediately after an ion impact.